Documentation Index
Fetch the complete documentation index at: https://docs.synq.io/llms.txt
Use this file to discover all available pages before exploring further.
The default freshness and volume monitors have been merged into the Table stats monitor. You can see more on the Table stats monitor page.
Setting up a freshness monitor
- Navigate to
Health→Manage monitors - Click
Create monitor groupto define the tables you want to monitor - Use the browser to narrow down the tables you want to monitor
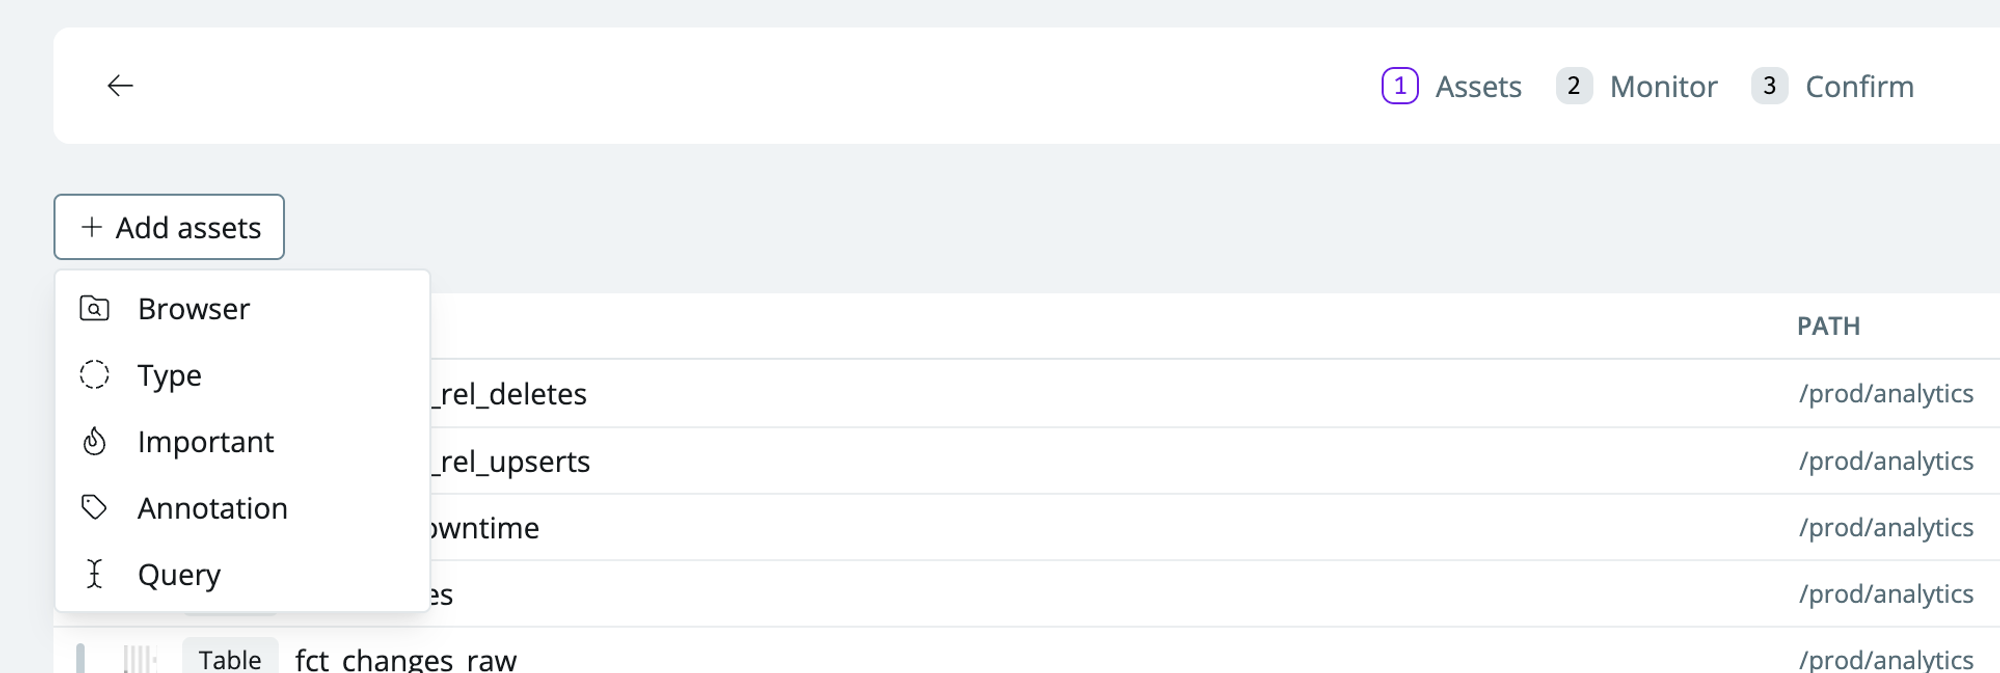
- Browser—select specific schemas or search for tables to monitor (your data warehouse tables and transformation models from dbt, SQLMesh, and Coalesce Transform are automatically mapped)
- Annotation—select assets with metadata definitions such as tags defined in your transformation layer (dbt, SQLMesh, or Coalesce Transform)
- Important—select assets that you’ve marked as important
- Query—advanced selection. E.g., search for specific keyword matches
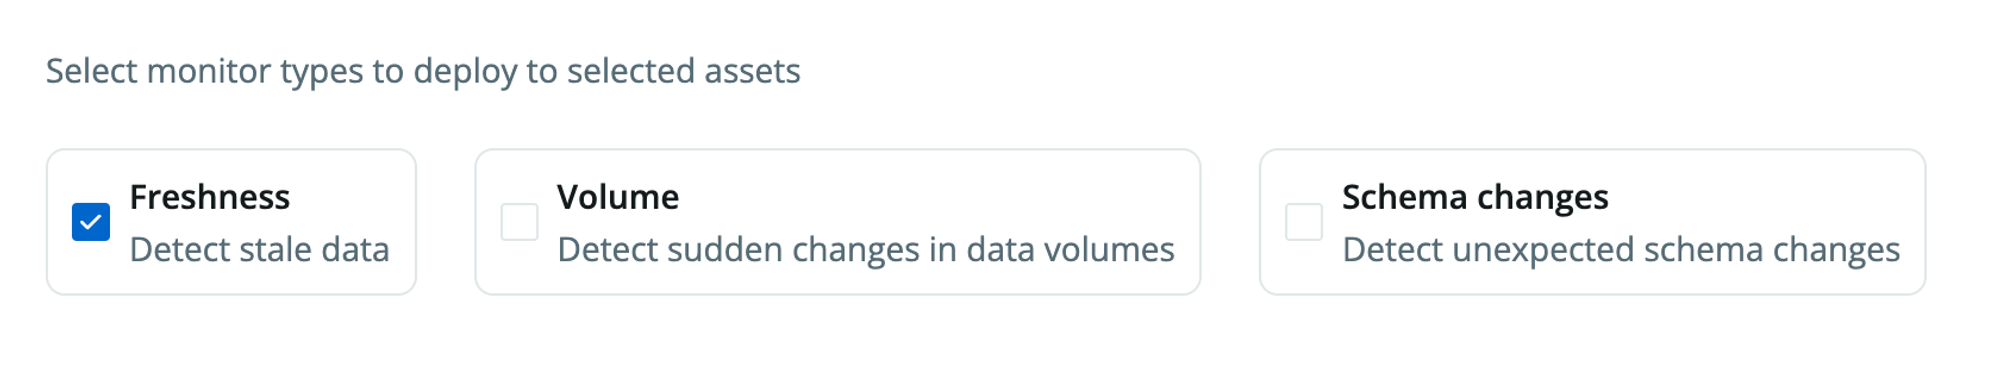
- Check
Freshnessto set up a freshness monitor group
- Name the monitor (e.g., freshness on all sources).
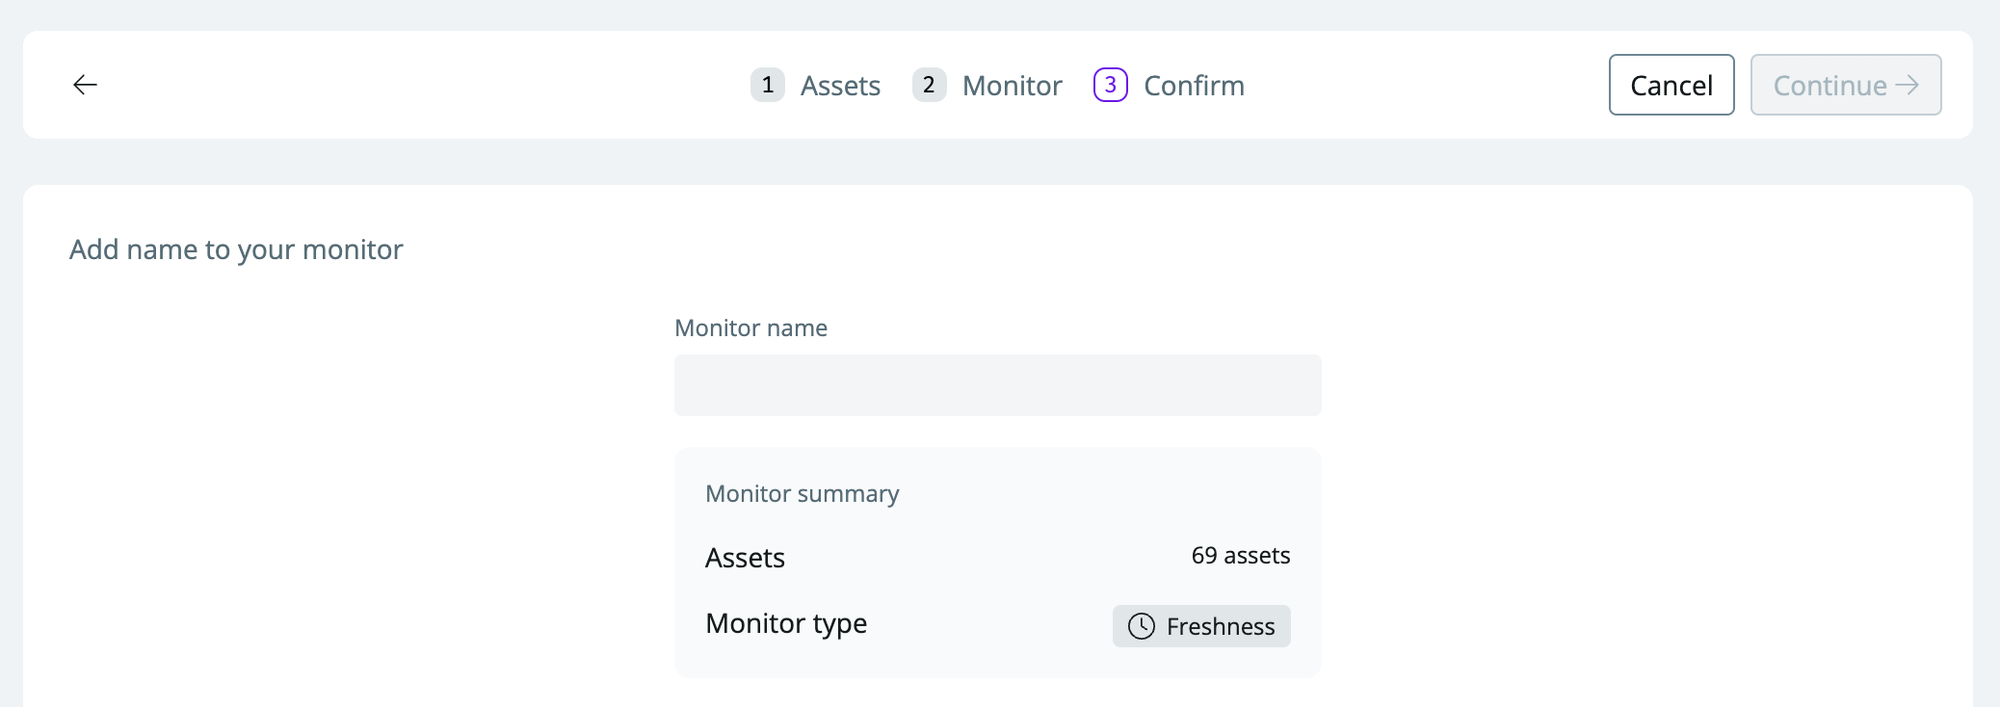
- Click
continueto set up the monitor
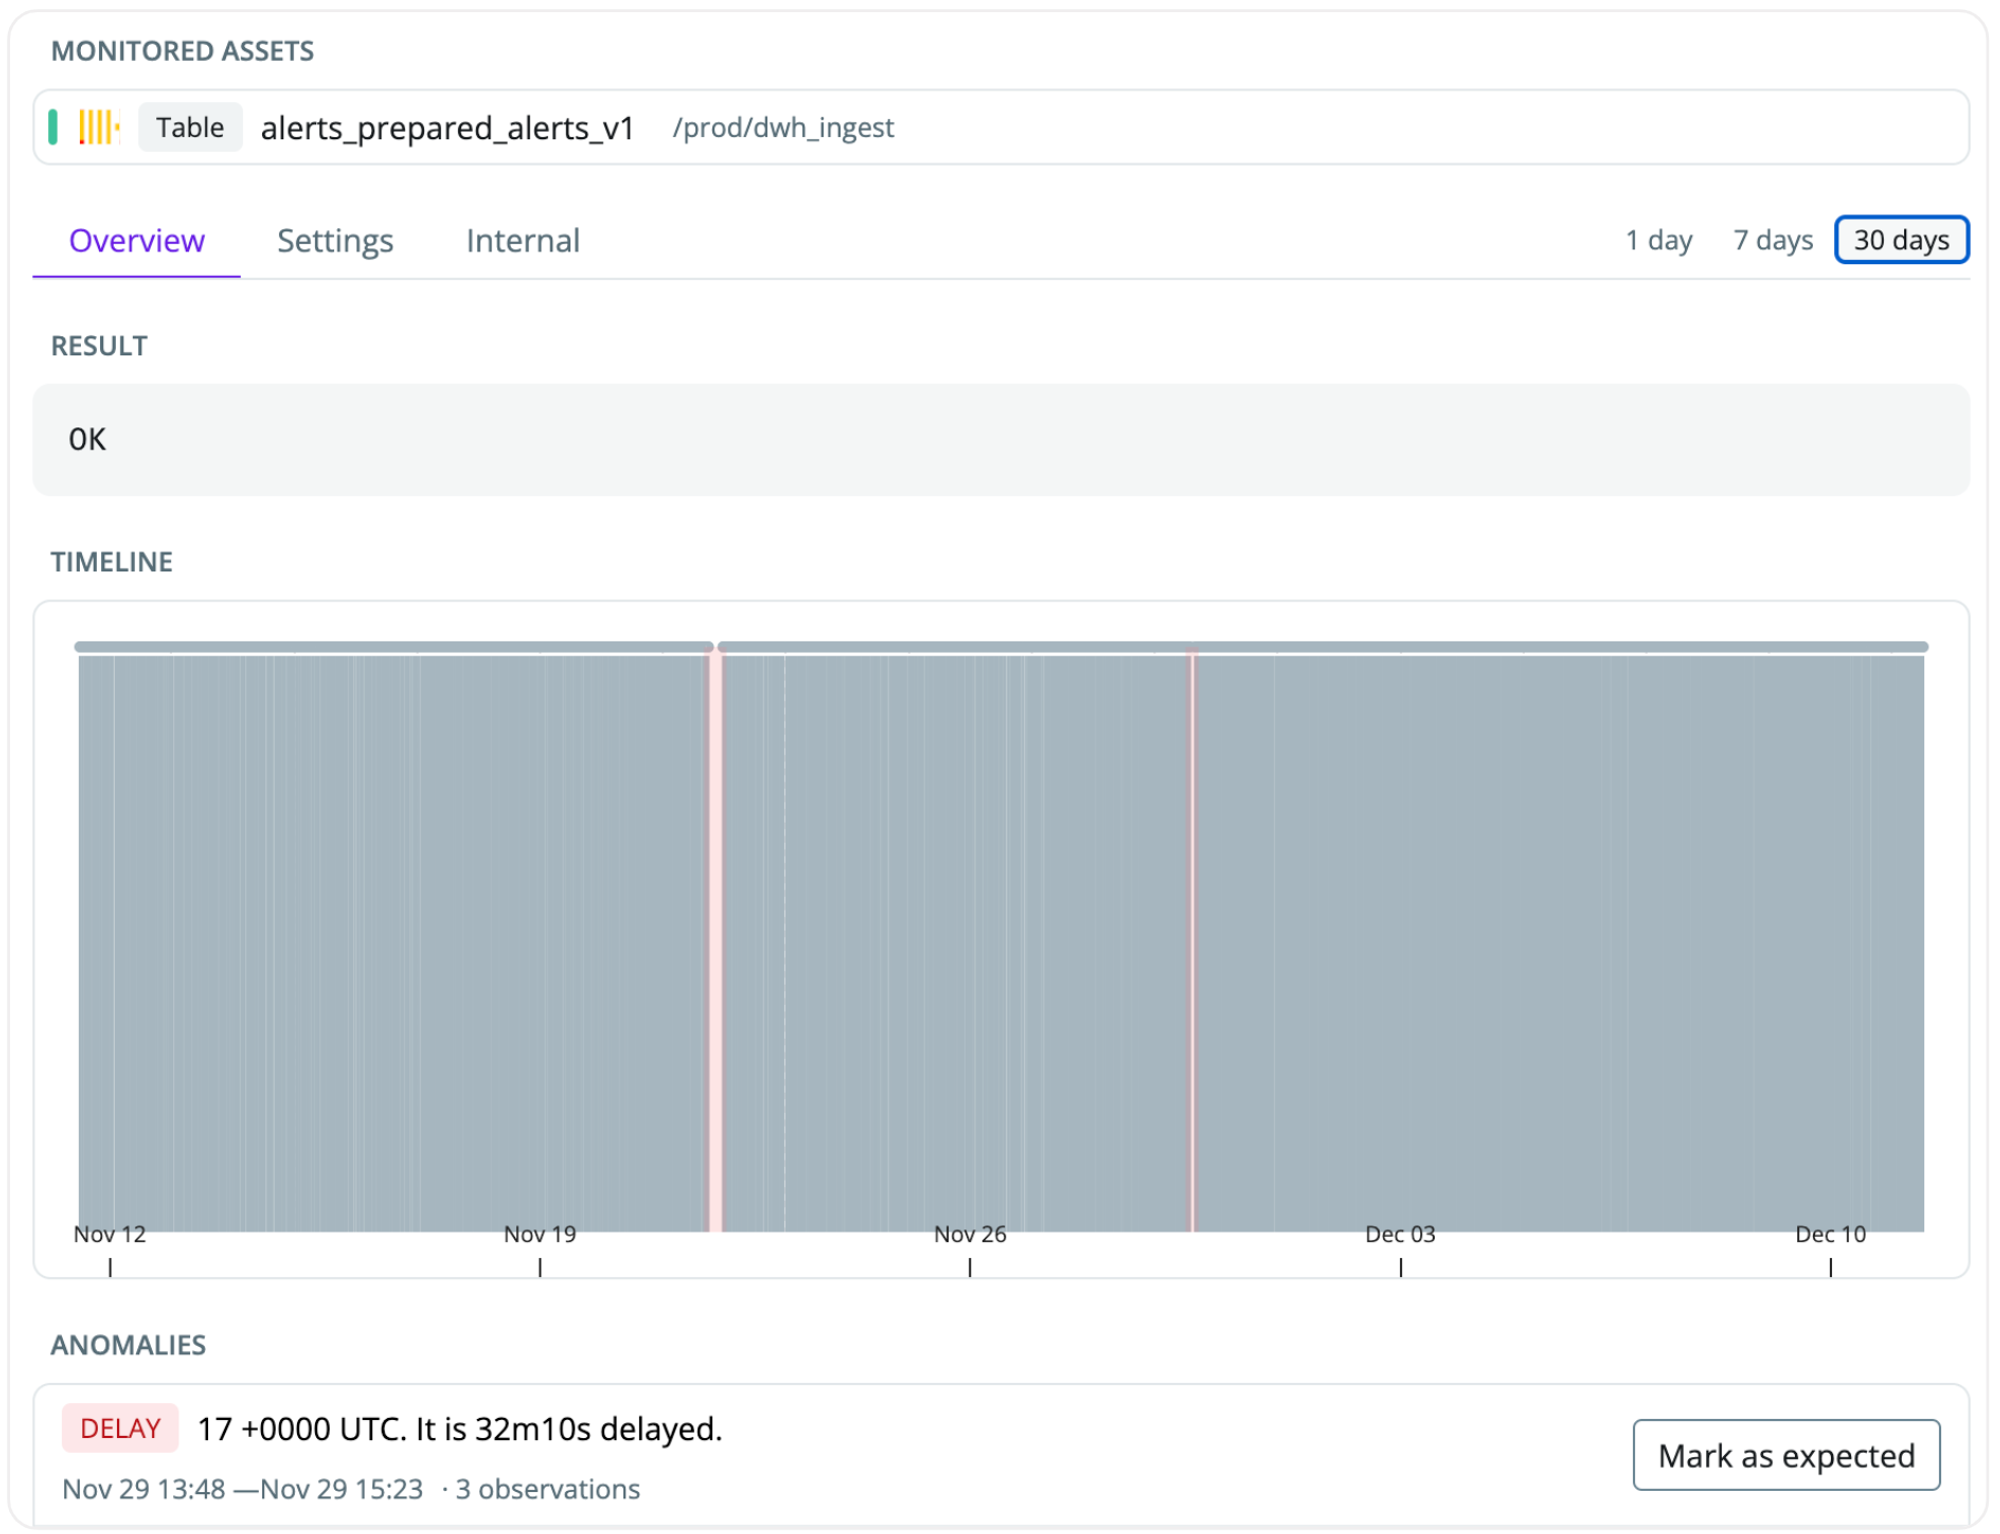
As soon as you’ve set the monitor up, it will start learning the behaviors of your data every hour. You should expect ~10 days before the monitor has built an understanding of the seasonality and patterns in your data and is confidently able to predict anomalies