

Monitor setup considerations
It’s essential to balance coverage and signal-to-noise ratio. While maximal monitoring across the stack may be appealing, it is not always the best option. It can cause alert fatigue and wear out your data team, causing important issues to be overlooked. The right monitor placement strategy can help with this. We’ve written extensively about how to best set up your monitoring in the Data Product’s guide. Here are a few guidelines.Designing a Testing Strategy
A well-structured testing strategy ensures comprehensive coverage across the data platform while minimizing redundancy. This involves defining testing approaches for each layer—sources, transformations, and data products—and considering how transformation layer tests (from dbt, SQLMesh, or Coalesce Transform) complement anomaly monitors to avoid redundant testing.Testing Sources
Testing at the source layer is critical because errors propagate downstream. Since this layer has the most dependencies, a strong foundation reduces the need for excessive testing further down the pipeline. See more in the Testing sources section of our guide.Testing Transformations
Once sources are well-tested, transformation testing can focus on verifying changes rather than duplicating checks already performed upstream. This includes validating logic and aggregations after joins. A targeted approach ensures transformations produce accurate and reliable results without unnecessary overhead. See more in the Testing transformations section in our guideTesting Data Products
Data product testing should be targeted and ideally done by data people with the relevant domain expertise. Instead of focusing on technical aspects of data, when testing data products, you should verify the logic encoded in SQL transformations. See more in the Testing products section of our guide.Setting up monitors
There are two ways to set up monitors in the app.1. Add a monitor to an individual table
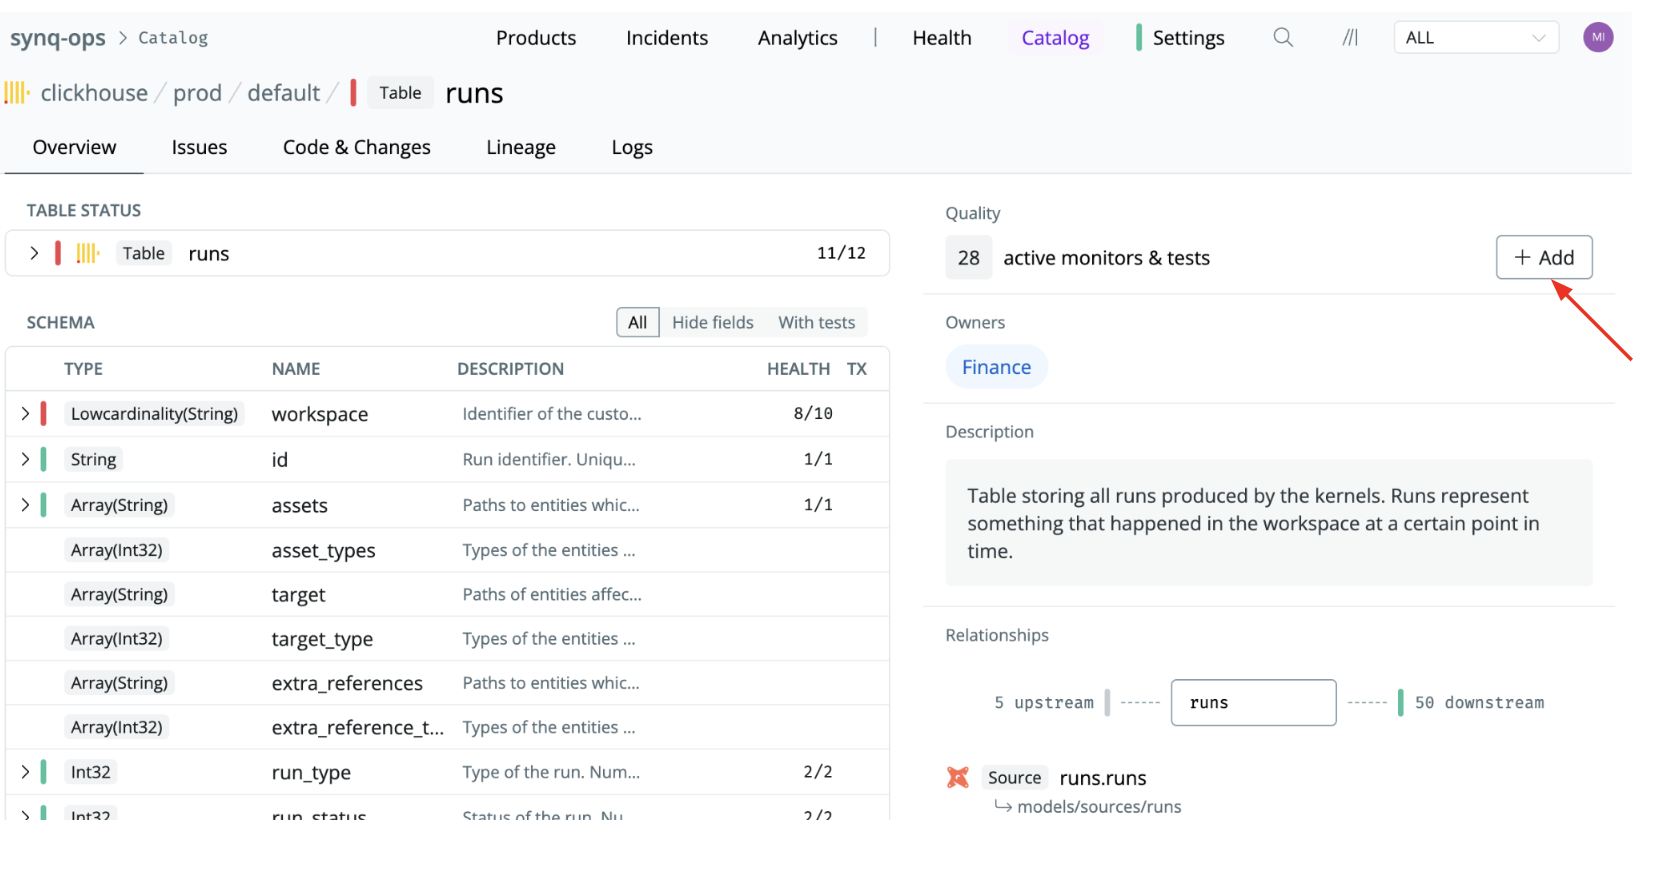
Set up monitors one table at a time. This is great for targeted monitoring where you just want to monitor specific tables. It’s also the only way to define custom monitors.- Navigate to the table or data model (e.g., by using the Catalog or Search functionality)
- Click the
+Addbutton and select a monitor type
2. Deploy monitors at scale
Use deployment rules to deploy monitors to many tables at once. For example, you can automatically add monitors to all sources upstream of a data product - the rule will also ensure that new sources added automatically will have monitors deployed. See Setting up deployment rules for how to get startedSetting up monitors programmatically
Monitors can also be created and changed outside the app, and all routes drive the same services — a monitor deployed from CI or created by an AI assistant is the monitor the app shows, with the same settings and the same history.- YAML — keep monitor placement in version control and deploy it from your
CI pipeline with
synqcli. See Defining monitors in code. - Public API —
synq.monitors.custom_monitors.v1.CustomMonitorsServicecovers custom monitors andsynq.monitors.automated_monitors.v1.DeploymentRulesServicethe rules that deploy monitors at scale. Reading monitors needs a token withSCOPE_MONITORS_READ; creating and editing them needsSCOPE_MONITORS_CUSTOM_EDIT, and anything touching deployment rules needsSCOPE_MONITORS_AUTOMATIC_EDIT. See the API reference and API scopes. - MCP — the monitor and test tools let an AI assistant pick a check type for a goal, create the monitor, and adjust it later. Listing monitors is covered by read-only consent; creating, updating and deleting need the Deploy permission, and a change that would reset a monitor’s baseline is confirmation-gated.