Creating a BI badge
- Navigate to Products
-
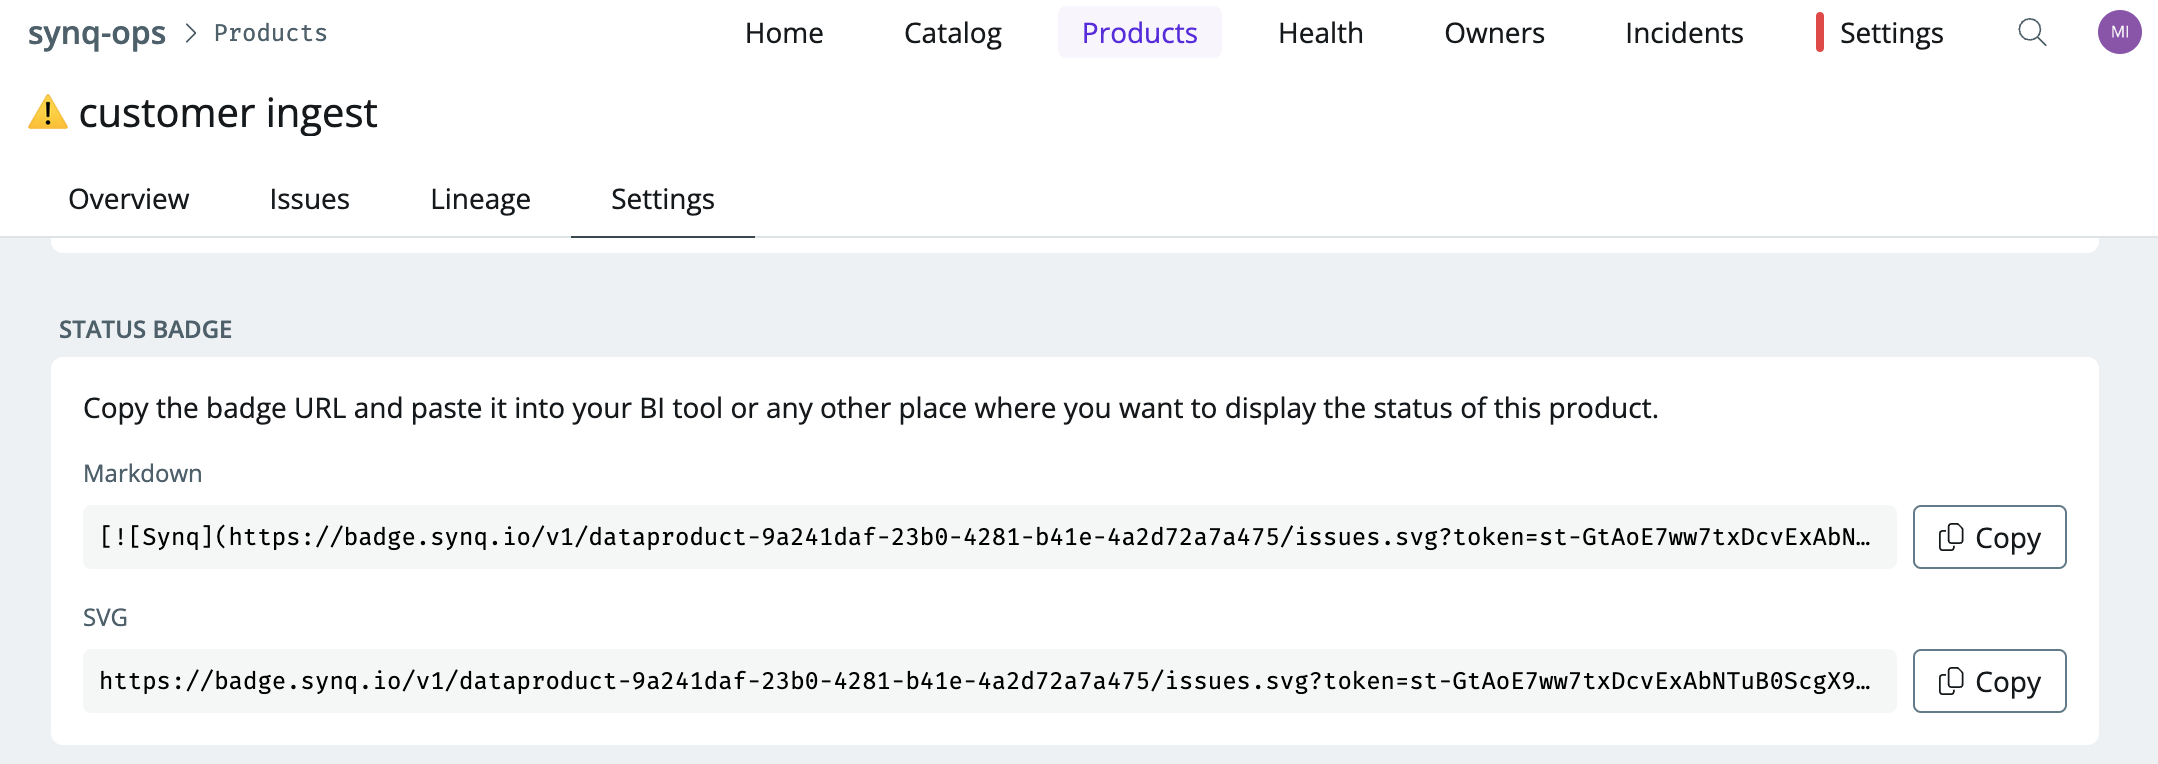
Select the data product that contains the assets that you want to display the status of in your BI tool and navigate to the
settingstab -
Depending on your BI tool, copy the relevant Markdown or SVG URL
- Navigate to your BI tool and insert a widget that points to the URL above. The level of support for this may vary depending on the BI tool you use
Looker example
If you use Looker, click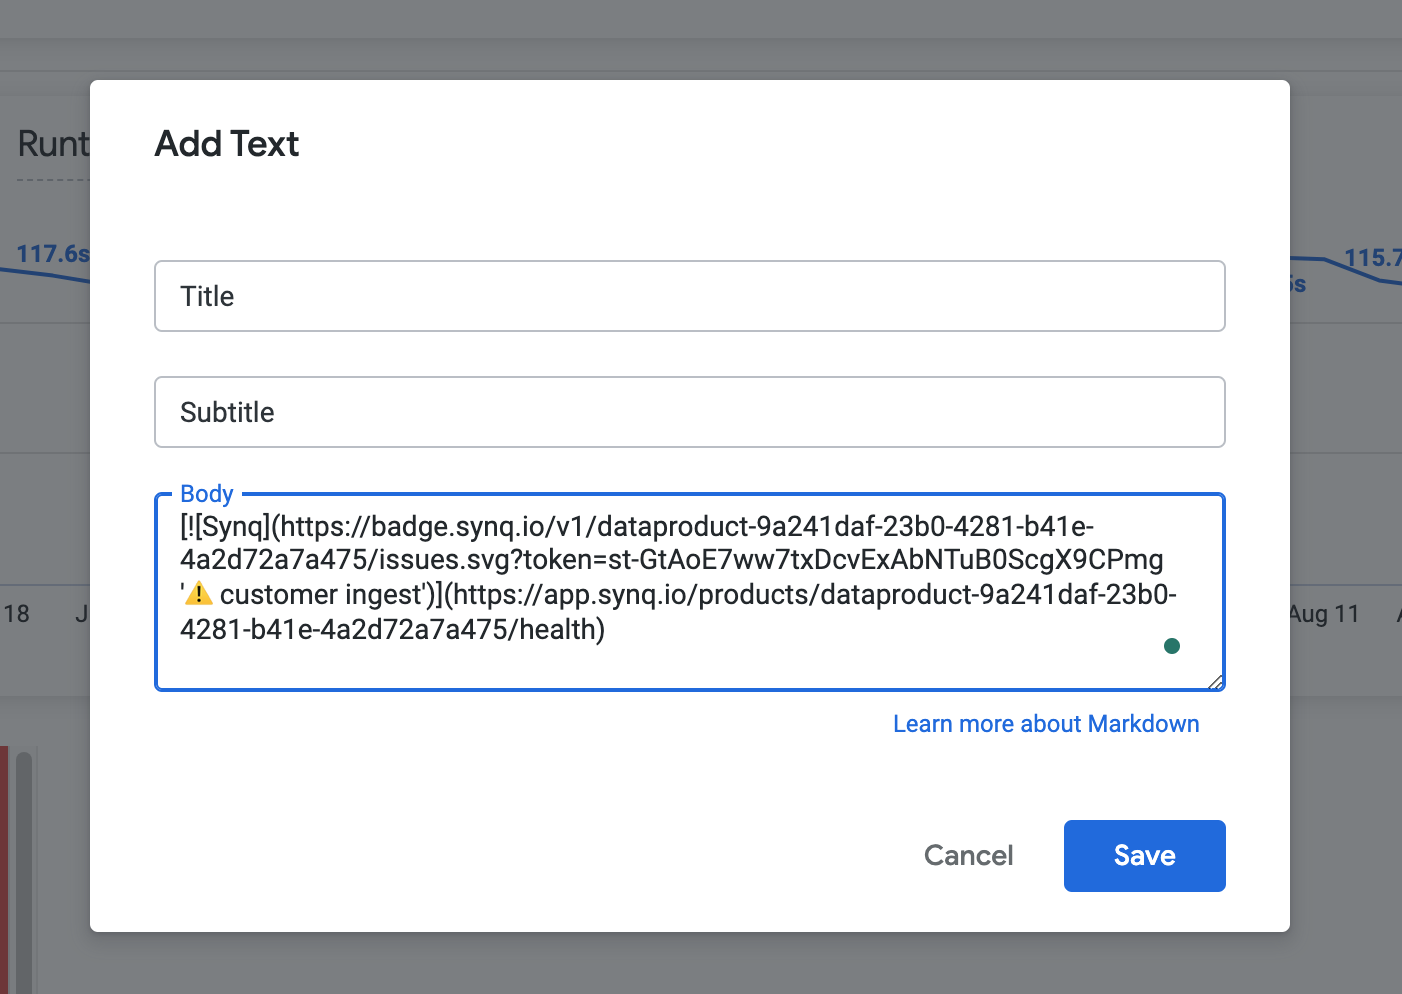
If you use Looker, click
Add > Markdown and paste the Markdown URL from Coalesce Quality into the Body-
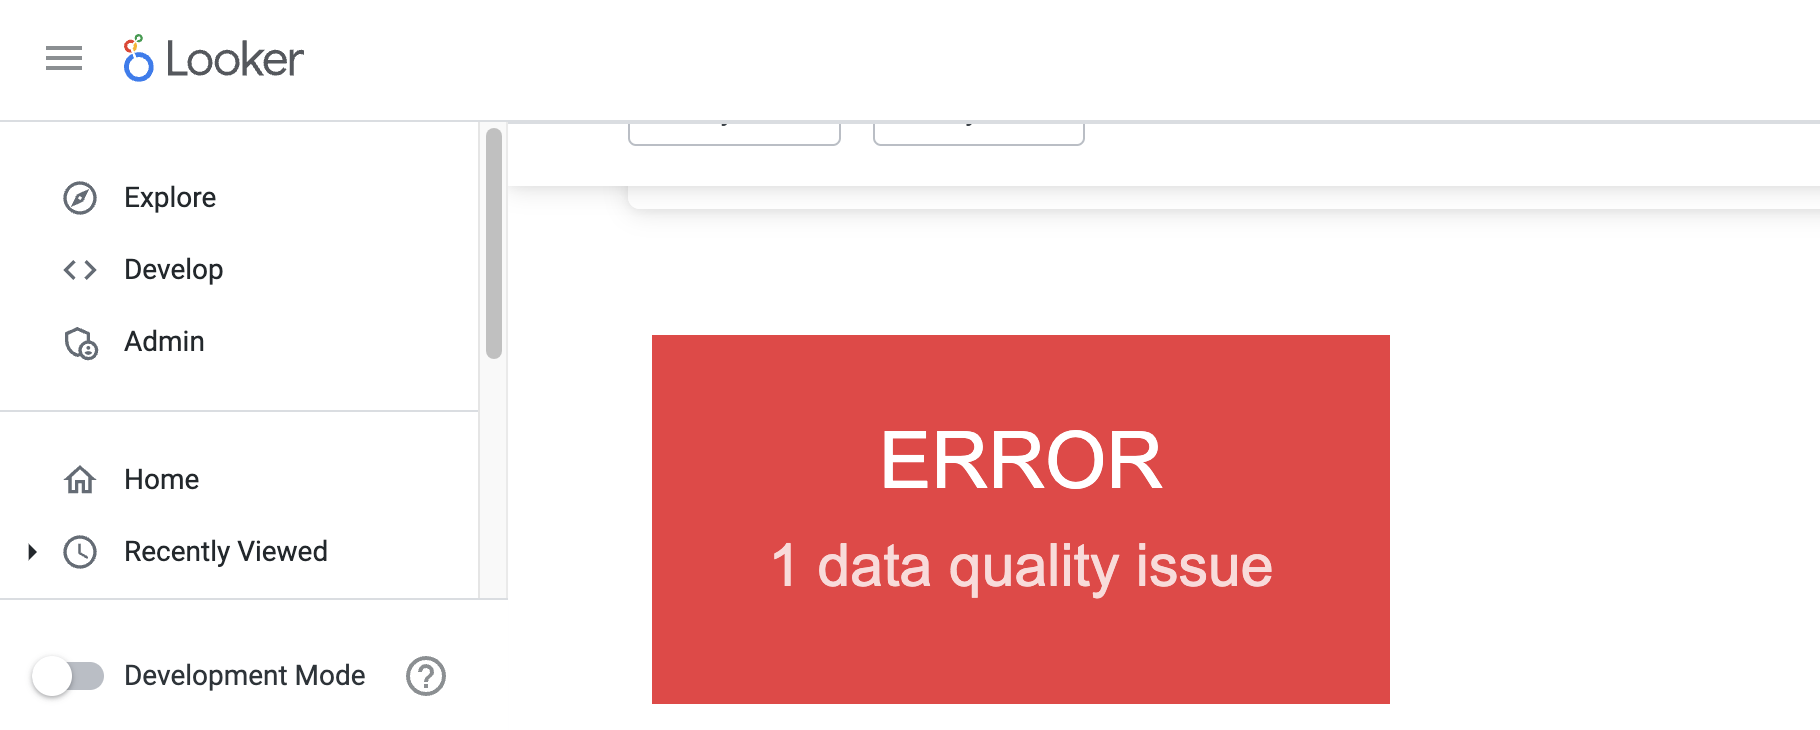
Your BI tool will show a tile with the status of the data product. Clicking on the tile brings you back to Coalesce Quality with an overview of the issues to connect the dots.