Skip to main contentThe table stats monitor is an all-in-one monitor to detect if data is not flowing or flowing at a reduced rate. This can help you be the first to know about issues without having to maintain manual thresholds for freshness or volume
- A source that’s entirely stopped sending data
- A source that’s sending significantly fewer/more rows
- A join that causes a spike in duplicate values
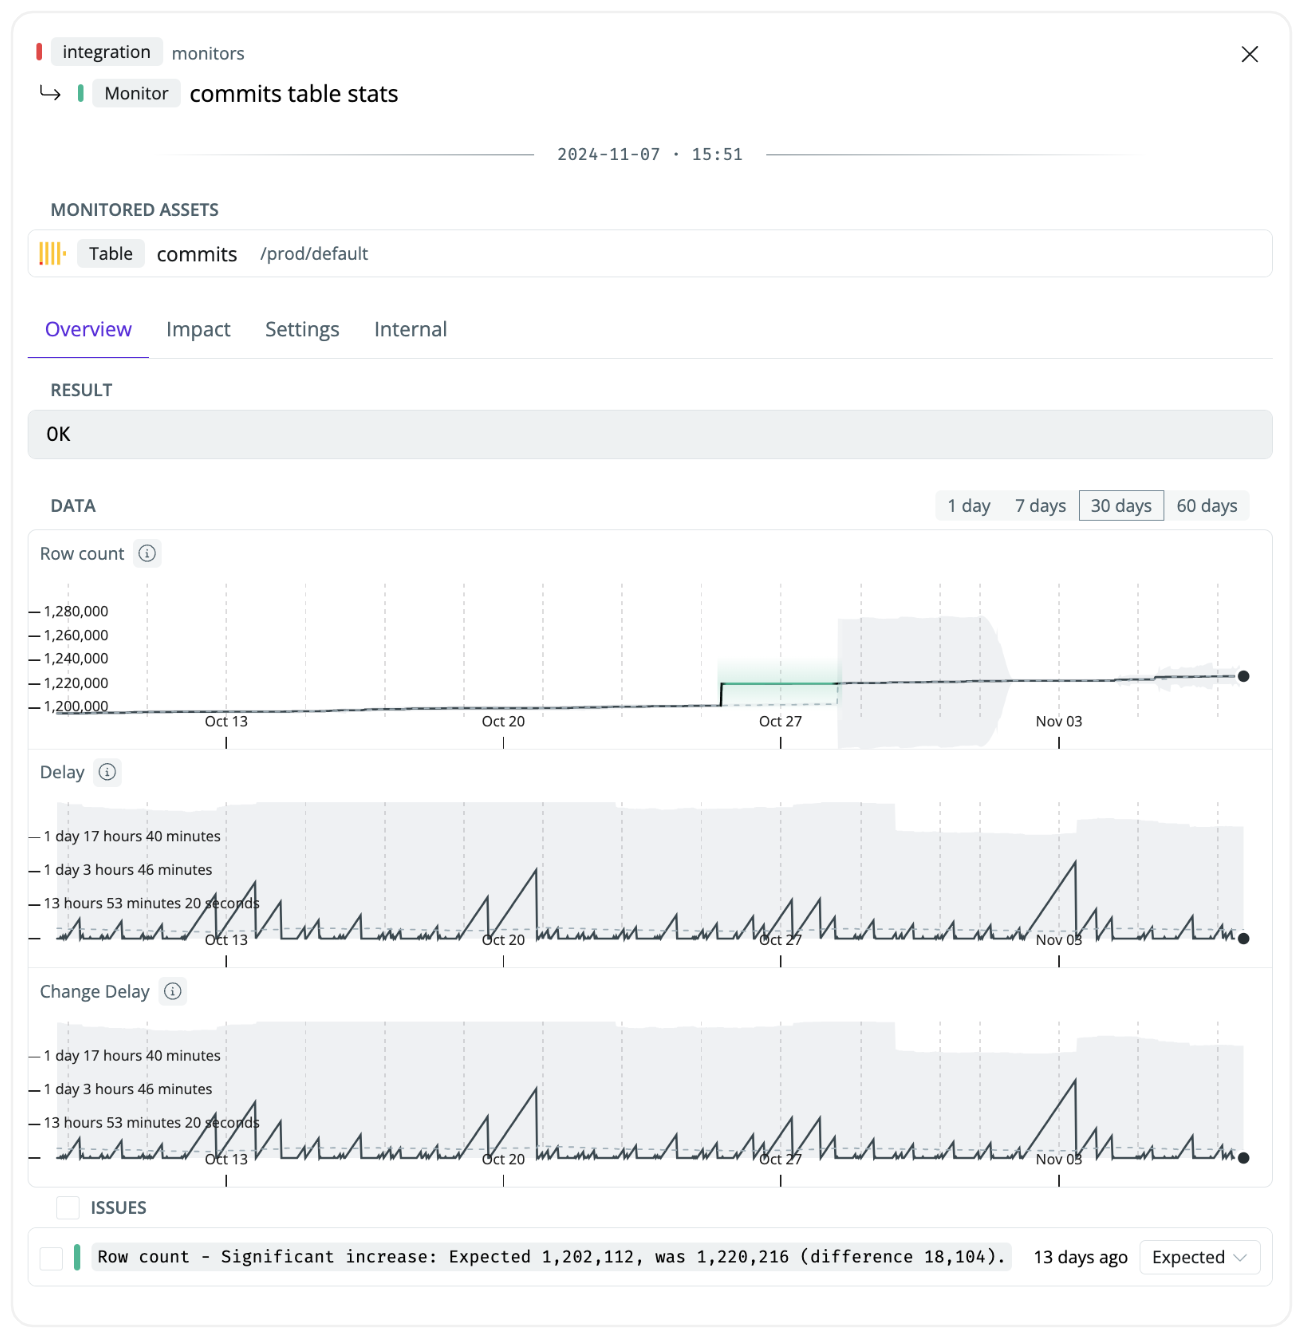
A table stats monitor highlighting a row count anomaly that’s been marked as expected
 To best possibly be able to catch different types of issues, the table stats monitor looks at three different signals
- Row count — the count of rows in the dataset
- Delay — the delay since the last time data was loaded
- Change delay — the delay since the last data load when at least one row was loaded
By combining the three, you’ll be more likely to detect different types of issues. For example, if an analytics engineer makes a join that creates a set of duplicate rows, the row count monitor can catch that. If an upstream source stops writing new data, the change delay monitor can catch that.
Unlike manual freshness checks (e.g., dbt source freshness or Coalesce freshness tests), all table stats are self-learning and automatically adjust to the patterns of your data. This reduces the workload on your end on defining specific thresholds.
Table stats monitors rely on your data warehouse metadata tables, such as the row_count from the Snowflake table information schema. As the monitor queries the information schema, you only incur minimal additional costs even when they are run frequently. The monitor works out of the box, which makes it easy to deploy at scale.
Setting up a table stats monitor
- Navigate to
Health → Manage monitors
- Click
Create monitor group to define the tables you want to monitor
- Use the SYNQ browser to narrow down the tables you want to monitor

- Browser—select specific schemas or search for tables to monitor (SYNQ automatically maps your data warehouse tables and transformation models from dbt, SQLMesh, and Coalesce Transform)
- Type—data asset type such as dbt source, Coalesce source, or SQLMesh external model
- Annotation—select assets with metadata definitions such as tags defined in your transformation layer (dbt, SQLMesh, or Coalesce Transform)
- Important—select assets that you’ve marked as important
- Product—select a data product to place monitor on or upstream of
- SynQL—advanced selection. E.g., search for specific keyword matches
-
Check
Table Stats to set up a table stats monitor group

-
Name the monitor (e.g., important sources).

-
Click
continue to set up the monitor
You’ll be able to see all monitors on the Health overview page and adjust the monitor sensitivity.
SYNQ automatically stores metadata from your tables, so the anomaly monitor will learn the expected thresholds as soon as you set it up. If you’re only just starting with SYNQ or you’re creating a new table that we don’t yet have metadata for, you should expect ~10 days before the monitor has built an understanding of the seasonality and patterns in your data and is confidently able to detect anomalies
How frequently do the monitors run
The table stats monitor is run every 30 minutes by default 


